
What if preventing disease became part of starting a family?
An optimistic model of disease prevention, healthcare savings, and cheaper reproductive technology.
What could fewer cases of diabetes, cancer, and autoimmune disease mean for families and healthcare spending?
We modeled how much disease burden better genetic information could help families already in IVF avoid.
Polygenic embryo screening estimates disease-risk differences between embryos to inform transfer decisions alongside a fertility team's assessment. Reticular focuses on complex disease and informed family choice.
We combined our Embryo Complete whitepaper with US disease-cost studies. These are modeled possibilities, not observed outcomes after screening. Explore the sourced spreadsheet.
About 89 fewer lifetime diabetes cases in 1,000 births.
Choosing the lowest-risk of five viable embryos gives a modeled 44.7% relative reduction from a 19.9% baseline lifetime diabetes risk. Across 1,000 births: 199 expected cases become 110.
Assumes five embryos capable of live birth per family, diabetes-only selection, and one child each. Excludes failed cycles. The population estimate is unadjusted for measured within-family attenuation.
From risk reduction to healthcare savings
Cases averted × attributable cost per case = gross savings. An ADA study puts annual diabetes-attributable medical costs at $12,022 in 2022 dollars, or roughly $12,886 in 2024 purchasing power. Assuming 20 treatment years starting at age 50 gives $258,000 per case and $22.9 million across 89 cases.
Annual expenditure is sourced; treatment onset and duration are assumptions. Savings depend on modeled risk differences translating into fewer diagnoses.
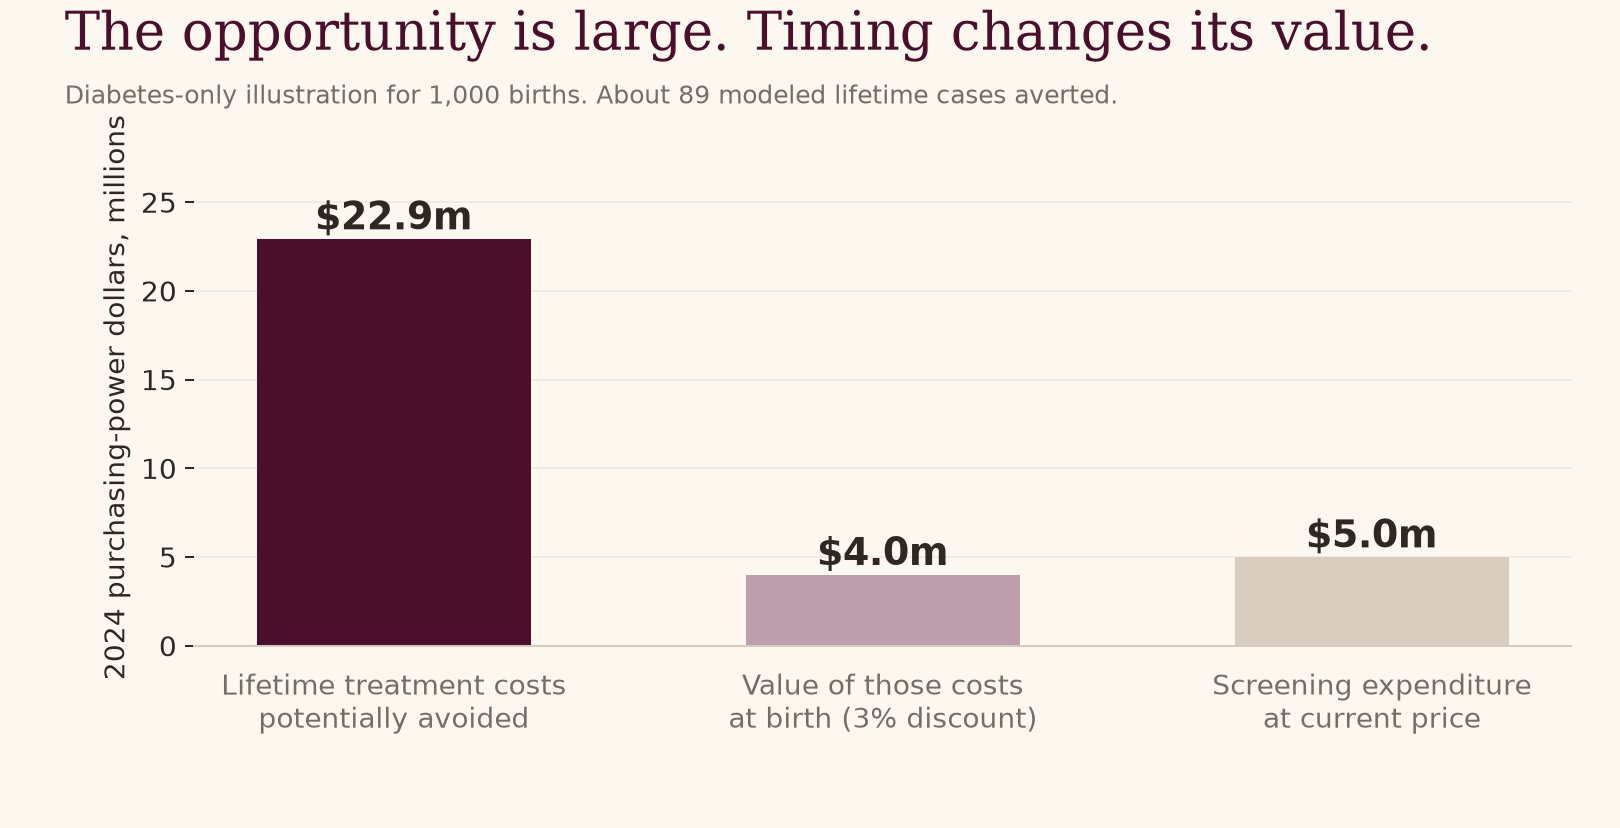
Discounting future treatment costs to birth at 3% reduces those savings to $4.0 million, below $5.0 million in current-price screening costs. At $1,000 per family, the same diabetes-only scenario yields roughly $3.0 million in net savings per 1,000 births.
The opportunity extends across serious diseases
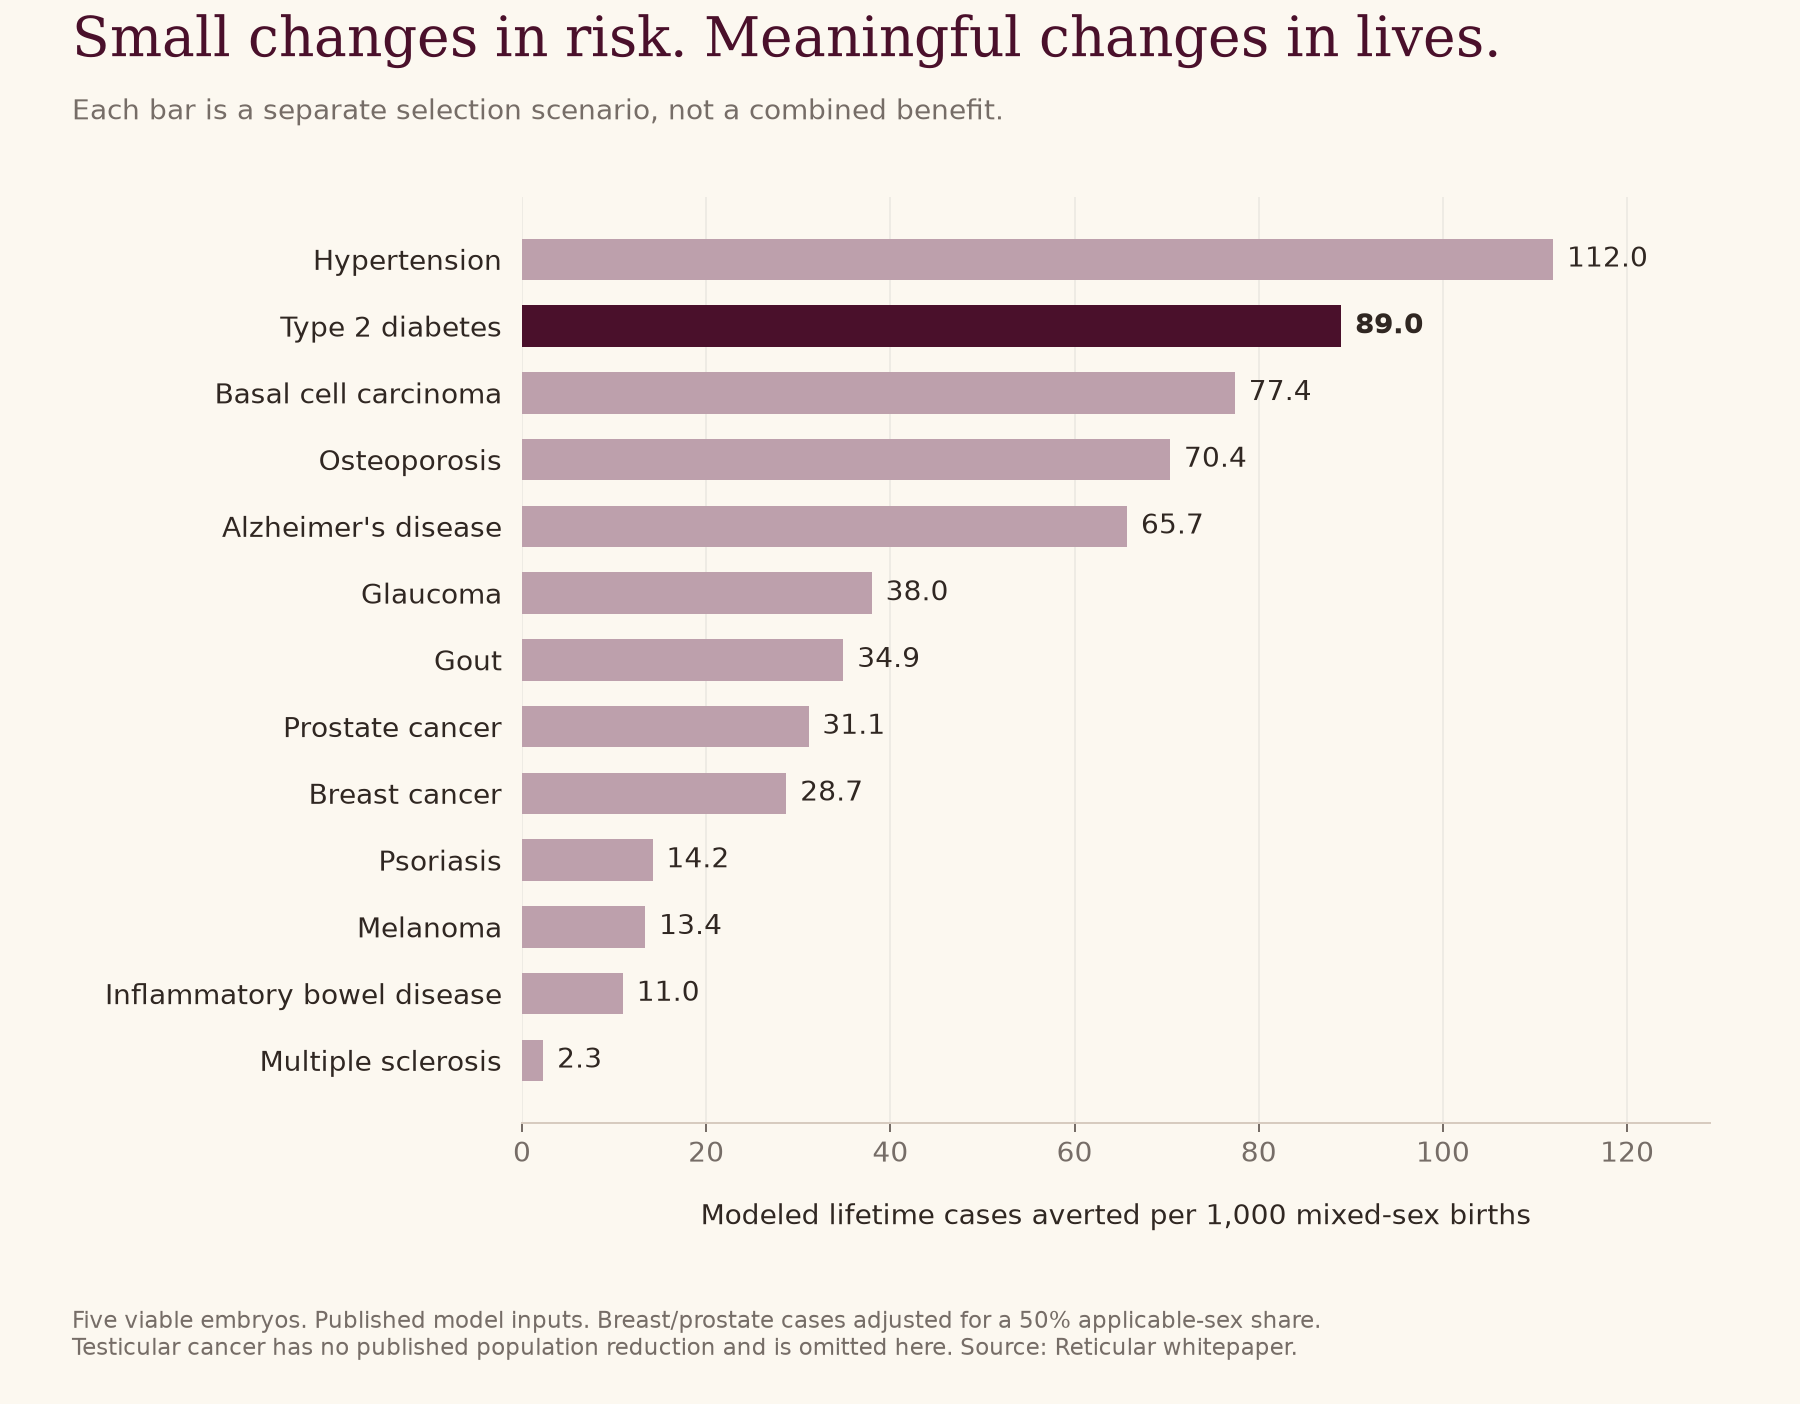
The whitepaper evaluates 14 conditions. Common diseases offer more potential cases averted; rarer conditions can carry substantial costs per case.
| Condition | Cases averted / 1,000 births | Original published cost input | Evidence |
|---|---|---|---|
| Alzheimer's disease | 65.7 | $28,501/yearRelated-condition proxy | Study 1 |
| Type 2 diabetes | 89.0 | $12,022/yearRelated-condition proxy | Study 2 |
| Prostate cancer | 31.1 | $28,421 initial + $2,915/yearPublished US cost estimate | Study 3 |
| Glaucoma | 38.0 | $1,863/yearPublished US cost estimate | Study 4 |
| Inflammatory bowel disease | 11.0 | $16,031/yearPublished US cost estimate | Study 5 |
| Gout | 34.9 | $3,038/yearPublished US cost estimate | Study 6 |
| Basal cell carcinoma | 77.4 | $1,243/yearRelated-condition proxy | Study 7 |
| Testicular cancer | Family-history scenario only | $17,283 treatment scenarioStage-specific model | Study 8 |
| Hypertension | 112.0 | $1,920/yearPublished US cost estimate | Study 9 |
| Multiple sclerosis | 2.3 | $65,612/yearPublished US cost estimate | Study 10 |
| Breast cancer | 28.7 | $36,125 initial + $4,372/yearPublished US cost estimate | Study 11 |
| Psoriasis | 14.2 | $3,592/yearPublished US cost estimate | Study 12 |
| Melanoma | 13.4 | $9,161 initial + $3,019/yearPublished US cost estimate | Study 13 |
| Osteoporosis | 70.4 | $8,572/yearPublished US cost estimate | Study 14 |
Costs retain original dollar years; normalization and durations are in the spreadsheet. Breast/prostate counts assume a 50% applicable-sex share. Testicular cancer uses the separate affected-parent model because no population reduction is supplied. Some cost inputs use related-disease proxies; these are not results from a common-population trial.
Families with a history of disease may have more to gain
With one affected parent, modeled diabetes risk falls from 30.7% to 18.0%: roughly 126 fewer cases per 1,000 births. The corresponding inflammatory bowel disease scenario falls from 9.9% to 4.7%.
These family-history scenarios are kept separate from population estimates in the spreadsheet.
What happens if this becomes much cheaper?
What if access expands and prices fall? These diabetes-only scenarios keep the published score unchanged and assume five viable embryos per family.
| Hypothetical future | Cases averted | Gross lifetime costs avoided | Net present value |
|---|---|---|---|
| Lower price, same science10,000 births; $1,000 screening | 890 | $0.23bn | $30m |
| Broad IVF access100,000 births; $500 screening | 8,895 | $2.29bn | $351m |
| Reproduction frontier1,000,000 births; $500 screening; $10,000 extra IVF | 88,953 | $22.93bn | −$6,493m |
| Low-cost reproduction future1,000,000 births; $500 screening; $1,000 extra IVF | 88,953 | $22.93bn | $2,507m |
Cohorts, not annual forecasts. Net present value deducts listed screening/extra-IVF costs and discounts treatment costs at 3%. Other health and societal benefits are excluded. Future prices are hypothetical.
At 100,000 births and $500 screening, even half the modeled risk reduction leaves roughly $150 million in net present savings under the same cost assumptions.
Extending this beyond families already in IVF changes the economics: $10,000 in extra IVF costs makes the modeled return negative; $1,000 makes it positive. Affordable reproductive technology is central to the larger opportunity.
Explore the assumptions yourself
Change condition, cohort size, screening price, and discount rate. Other costs and durations follow the spreadsheet; families are already in IVF with five viable embryos.
20 assumed cost years beginning at age 50. Approximate 2024 purchasing power. One family, one birth; five viable embryo options; one disease optimized. Estimates are not a clinical recommendation.
Health gains beyond healthcare savings
The model excludes much of the value of caregiving, independence, and healthy years. A US dementia study estimated $13,188 annually in unpaid-care opportunity costs, in 2010 dollars, beyond purchased care. Those costs are not in our medical-savings headlines.
Health gains matter even without net medical savings. Longer lives can also add healthcare costs; this model does not project those survival effects.
The workbook includes disease eradication as a hypothetical burden ceiling, not a screening outcome. Complex disease also has environmental causes; screening neither treats existing patients nor guarantees health.
Better validation, lower costs, and broader access could expand the opportunity. The workbook compares published Reticular, Herasight, and Nucleus prediction benchmarks, but those do not establish which provider delivers the greatest health or economic benefit.
Help improve the model
Which assumptions would you change? What evidence would make this opportunity most compelling?
Explore the full modelDownload the Excel workbook, model inputs, or family-history assumptions. Downloads are a snapshot; the shared Sheet is the team working copy.
Sources, assumptions, and what to improve next
Source inputs were reviewed November 9, 2026. All 14 whitepaper conditions are represented. Costs use US studies, with varying study populations. Dollar normalization uses BLS CPI-U, targeting 2024 purchasing power. The IBD, hypertension, osteoporosis, and testicular cost-year mappings are disclosed assumptions pending confirmation. CPI normalization is approximate and does not model future medical-price changes.
Risk inputs come from the whitepaper article, its numerical inputs, and its methods, which use a published single-condition selection framework. The article labels its figures provisional. Alzheimer's and testicular within-family estimates are unstable. Diabetes population risk reduction is unadjusted for observed within-family attenuation. Several prevalence inputs are provisional and should not be presented as independently established US lifetime risks.
This is an exploratory economic scenario, not a clinical recommendation or validated cost-effectiveness result. It does not include IVF attrition, long-run survival, a joint multi-disease selection policy, or intergenerational compounding. The 2022 US diabetes cost proxy includes type 1 and type 2 diabetes. All annual cost durations and onset ages are analyst assumptions. Cancer estimates use an initial phase and assumed continuing years, without adding terminal-care costs. Current nominal screening price is treated as a constant-dollar planning proxy. The eradication ceiling in the workbook is a burden illustration, not a screening result.
- Alzheimer's disease: Hurd et al., NEJM 2013, Table 2. Paid medical and long-term care; all-dementia proxy. Dementia rather than Alzheimer-specific; unstable within-family score estimate.
- Type 2 diabetes: ADA, Economic Costs of Diabetes 2022. Diabetes-attributable annual medical expenditure. All diagnosed diabetes cost proxy for type 2. Score attenuation within families is not corrected.
- Prostate cancer: NCI / Mariotto et al., site and phase tables. First year plus continuing medical and oral drug costs. Medicare-derived costs transported to a future birth cohort. Terminal care excluded.
- Glaucoma: Rasendran et al., J Glaucoma 2022, abstract. Adjusted annual incremental healthcare expenditure. Whitepaper POAG population transport and phenotype mismatch remain provisional.
- Inflammatory bowel disease: Park et al., IBD 2020, Results / Figure 2. Annual patient-minus-control paid claims. Dollar year 2016 used as a normalization assumption, not verified. Cost difference is observational.
- Gout: Wu et al., JMCP 2008, Results. Adjusted annual excess all-cause medical expenditure. Older insured cohort; residual comorbidity attribution possible. Whitepaper sex/population pairing provisional.
- Basal cell carcinoma: Kao et al., Cancer Causes Control 2023, Table 1. Nonmelanoma skin-cancer treatment cost proxy. Includes squamous cell cancer; not a BCC-only estimate. Three treatment years is an analyst assumption.
- Testicular cancer: Aberger et al., Cancer Medicine 2014, Abstract. Early-stage seminoma treatment and surveillance scenario. Stage-specific modeled cost, not average lifetime cost; 2013 normalization year assumed. No population RRR supplied.
- Hypertension: Kirkland et al., JAHA 2018, abstract. Adjusted annual incremental healthcare expenditure. 2014 normalization year assumed from end of observation window; not independently verified.
- Multiple sclerosis: Bebo et al., Neurology 2022, Table 2. Annual excess direct medical costs. Assumes current excess cost persists for 30 years; onset and duration are assumptions.
- Breast cancer: NCI / Mariotto et al., site and phase tables. First year plus continuing medical and oral drug costs. Female model only; 50% cohort sex share assumed without selecting sex. Terminal care excluded.
- Psoriasis: Merola et al., Clin Rheumatol 2021, abstract. Annual matched patient-minus-control all-cause costs. Uses psoriasis without psoriatic arthritis; observational cost difference.
- Melanoma: NCI / Mariotto et al., site and phase tables. First year plus continuing medical and oral drug costs. Medicare-derived costs; terminal care excluded; not current advanced-drug pricing.
- Osteoporosis: Marginal health care expenditures, JAPhA 2025, abstract. Adjusted annual marginal healthcare expenditure. 2021 normalization year assumed. Whitepaper K is a model input, not validated US birth-cohort lifetime incidence.